New maps reveal that the 28 of the largest cities in the United States are sinking
New satellite maps show that the 28 largest cities in the United States are sinking, affecting millions of residents.
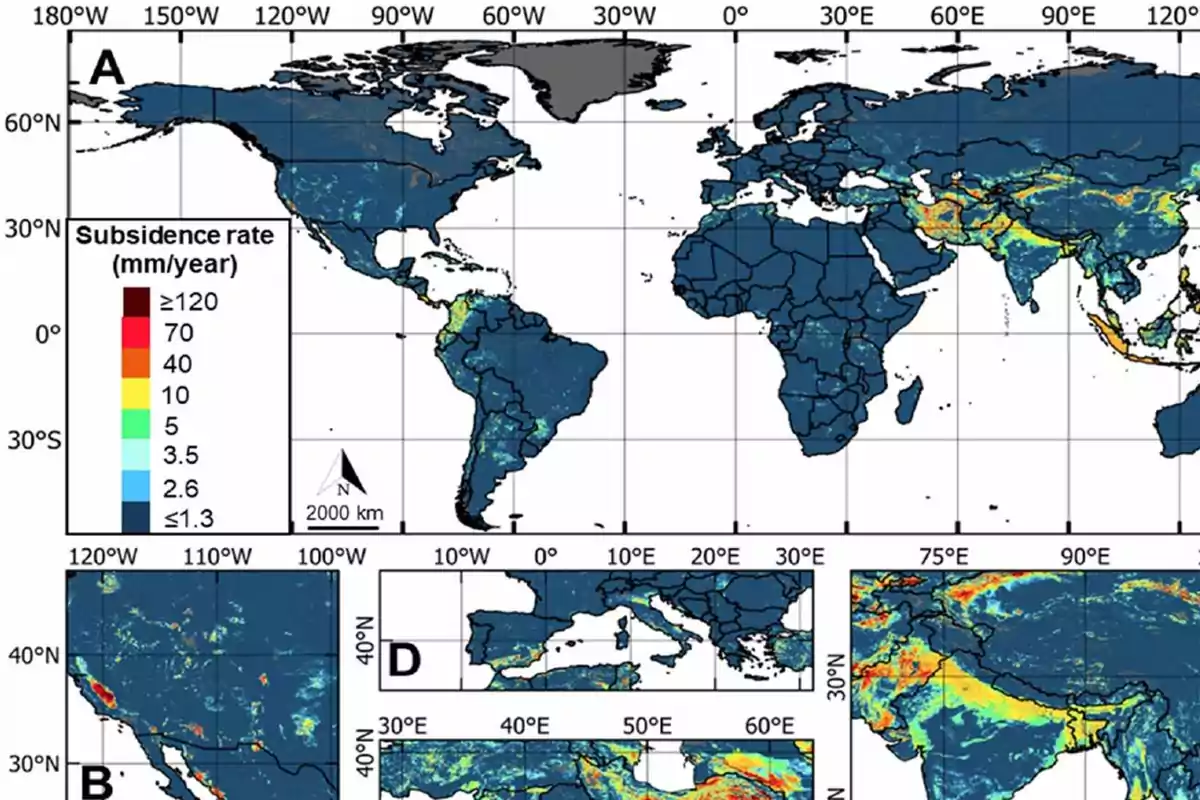
All 28 of the most populous U.S. cities are subsiding to some degree, according to a new, millimeter-scale analysis of land motion from 2015 to 2021. The study estimates that 33.8 million residents live on sinking ground and flags more than 29,000 buildings in high or very high risk zones where uneven settling can strain foundations.
Subsidence is often slow a few millimeters a year but it adds up and, when uneven, structures can tilt and crack pavement. The authors link faster sinking to higher flood exposure: eight cities with zones subsiding more than 3 millimeters per year have seen more than 90 significant flood events since 2000, a risk that could rise as extreme rainfall intensifies.
How satellites mapped city sinking
Researchers used Sentinel-1 radar satellites and a multiyear interferometric analysis to map vertical land motion across each city at roughly 28-meter resolution. In every city, at least 20% of the area is sinking; in 25 out of 28 cities, at least 65% of the land is sinking. Nine cities recorded area-weighted average subsidence above 2 millimeters per year—small on paper, but that is roughly a tenth of an inch a year and nearly an inch per decade.
Houston stands out: 42% of its land is dropping faster than 5 millimeters per year (about a fifth of an inch annually), and 12% is sinking faster than 10 millimeters yearly (nearly 2 inches per decade). Citywide, 4.7 million people are exposed to subsidence greater than 3 millimeters per year, and 1.1 million face rates over 5 millimeters yearly.
What drives U.S. land subsidence
Groundwater decline is a major factor where aquifers are confined by less-permeable layers. Across wells in these confined systems, changes in water level explained 76% of the variation in non-glacial subsidence; the relationship is weaker in unconfined aquifers, underscoring how geology governs local sensitivity.
The Northeast adds a natural push: long-term glacial isostatic adjustment (the slow settling of land that once bulged near the edge of the Ice Age ice sheet) contributes about 1 to 3 millimeters per year in cities including New York, Philadelphia, and Washington, D.C. Hot spots include parts of LaGuardia Airport in New York, with additional sinking mapped around Jamaica Bay and Staten Island.
Buildings at the highest subsidence risk
Most properties fall in low to medium-risk categories, however the study identifies more than 29,000 buildings in high and very high risk zones. The differential settling in these zones is measured as angular distortion and raises concern for tilting and structural stress.
San Antonio has the highest share of at-risk buildings (about 1 in 45), followed by Austin (1 in 71), Fort Worth (1 in 143), and Memphis (1 in 167). San Antonio, Austin, and Houston together account for over 82% of the nation’s “very high risk” buildings.
What cities should do next
“As cities continue to grow, we will see more cities expand into subsiding regions,” said lead author Leonard Ohenhen, a postdoctoral researcher at Columbia University’s Lamont-Doherty Earth Observatory. “Over time, this subsidence can produce stress on infrastructure that will go past their safety limit.”
Remedies depend on the driver: where pumping dominates, cities can curb withdrawals and use managed aquifer recharge; where flood risk rises with lowering ground, upgrades to drainage and green infrastructure can help; and where tilting is the issue, building codes, retrofits, and careful siting matter the most.
Limits, caveats, and next steps
A citywide sinking rate does not mean a building will fail. The authors stress that more than 99% of the 5.6 million buildings they screened fall in low to medium-risk zones; high-risk clusters are localized and warrant targeted assessments.
At broad, county scales, groundwater-use totals did not show a simple linear tie to land motion, indicating that local aquifer properties and well placement matter. The new maps give planners a shortlist block by block of places to monitor, reinforce, or avoid.
The study is published in Nature Cities.
More posts: